This report is a description of the patterns observed when melting an ice block in a stable stratification.
This is important because it is a lab-scale analogue of the melting of the front of glaciers in the ocean. These glaciers are where we see the most ice loss in the real world.Overview
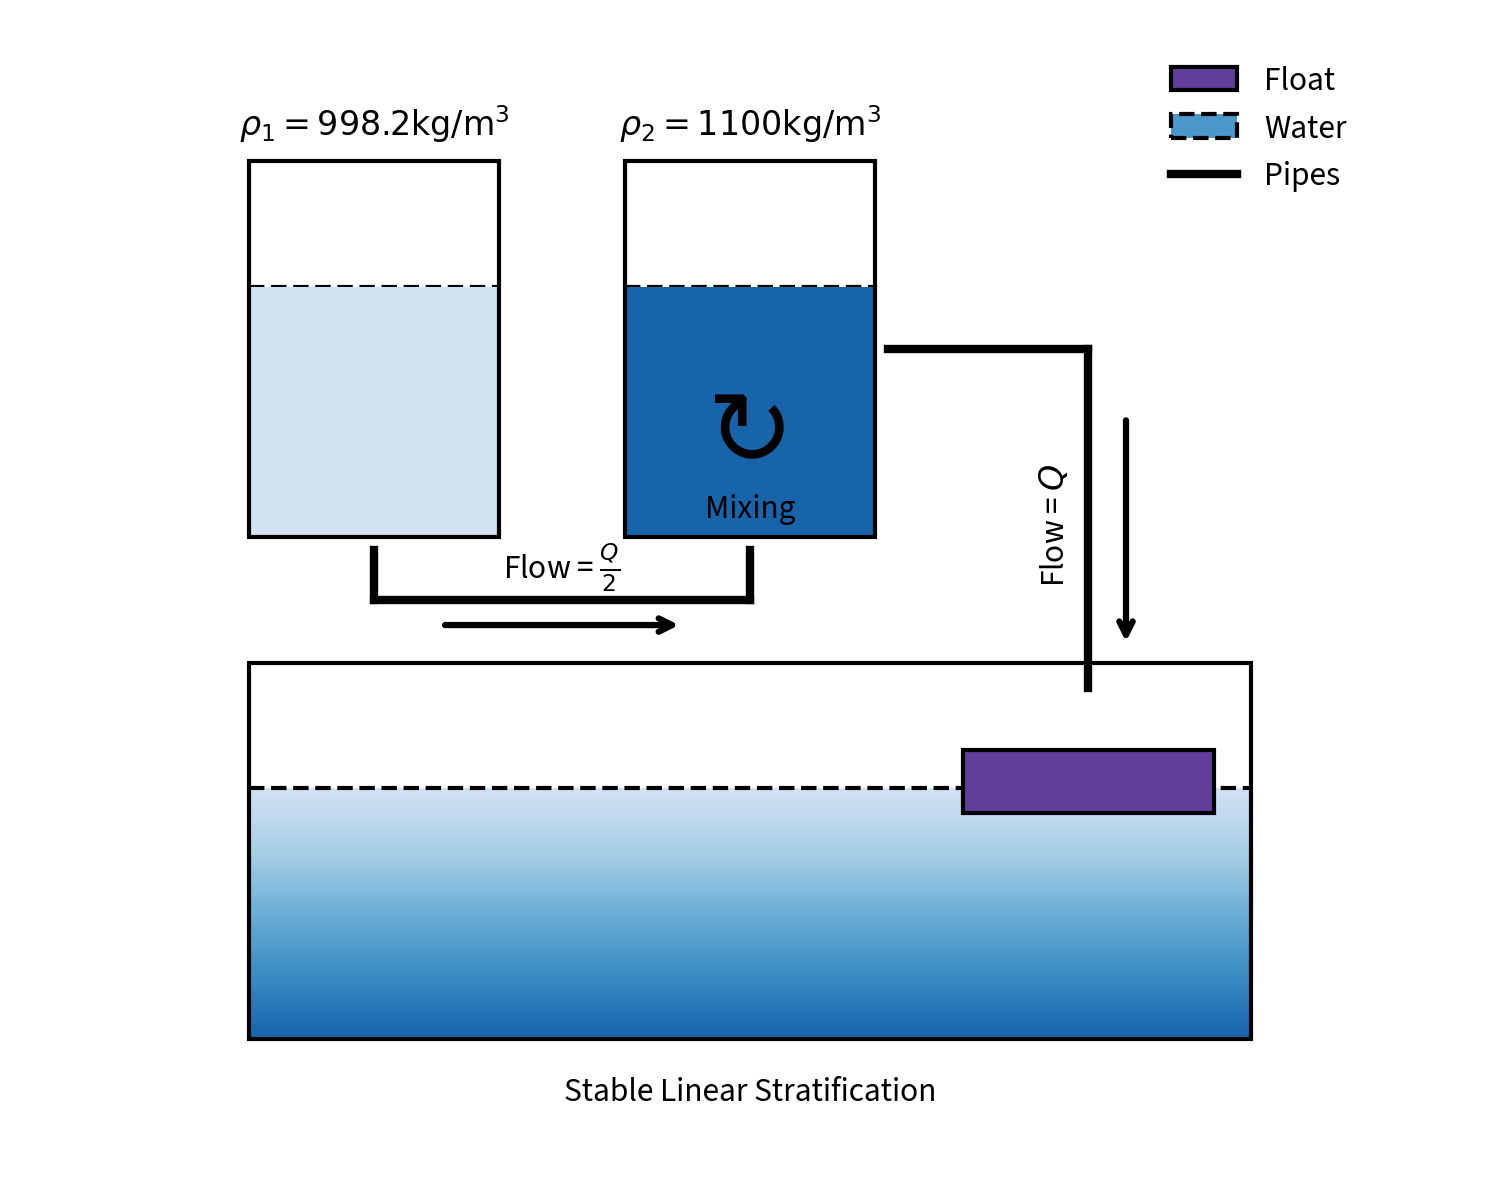
Anthropogenic climate change is very likely to be associated with current ice sheet melt and sea level rise, which will continue to increase associated risks for at least centuries to come (IPCC 2023). Ice sheet mass loss is driven by the sum of frontal ablation and climatic-basal balance, with frontal ablation in marine terminating glaciers being the dominant driver of loss in Greenland and both halves of Antarctica (Kochtitzky et al. 2023; Dømgaard et al. 2024; Cook et al. 2014). Submarine melting provides a control on frontal ablation of marine terminating glaciers both directly and by affecting the rate of calving (O’Leary and Christoffersen 2013; Ma and Bassis 2019). Some work suggests that this melting has been historically underestimated (Sutherland et al. 2019). The velocity of dissolution/melting is dependent on the salinity, which has further effects on the turbulence near the interface and the speed of melt (Kerr and McConnochie 2015). Additionally, the profile of melting and the dynamics of flow are dependent on the stratification (Yang et al. 2023). The experiment conducted in this report reproduces the work of Huppert and Turner 1980 by measuring at lab scales the melting of a vertically oriented ice block in a stable stratification. This experiment allows us to view a complex system of double-diffusive processes that have utility in the modeling and parametrisation of ice melting
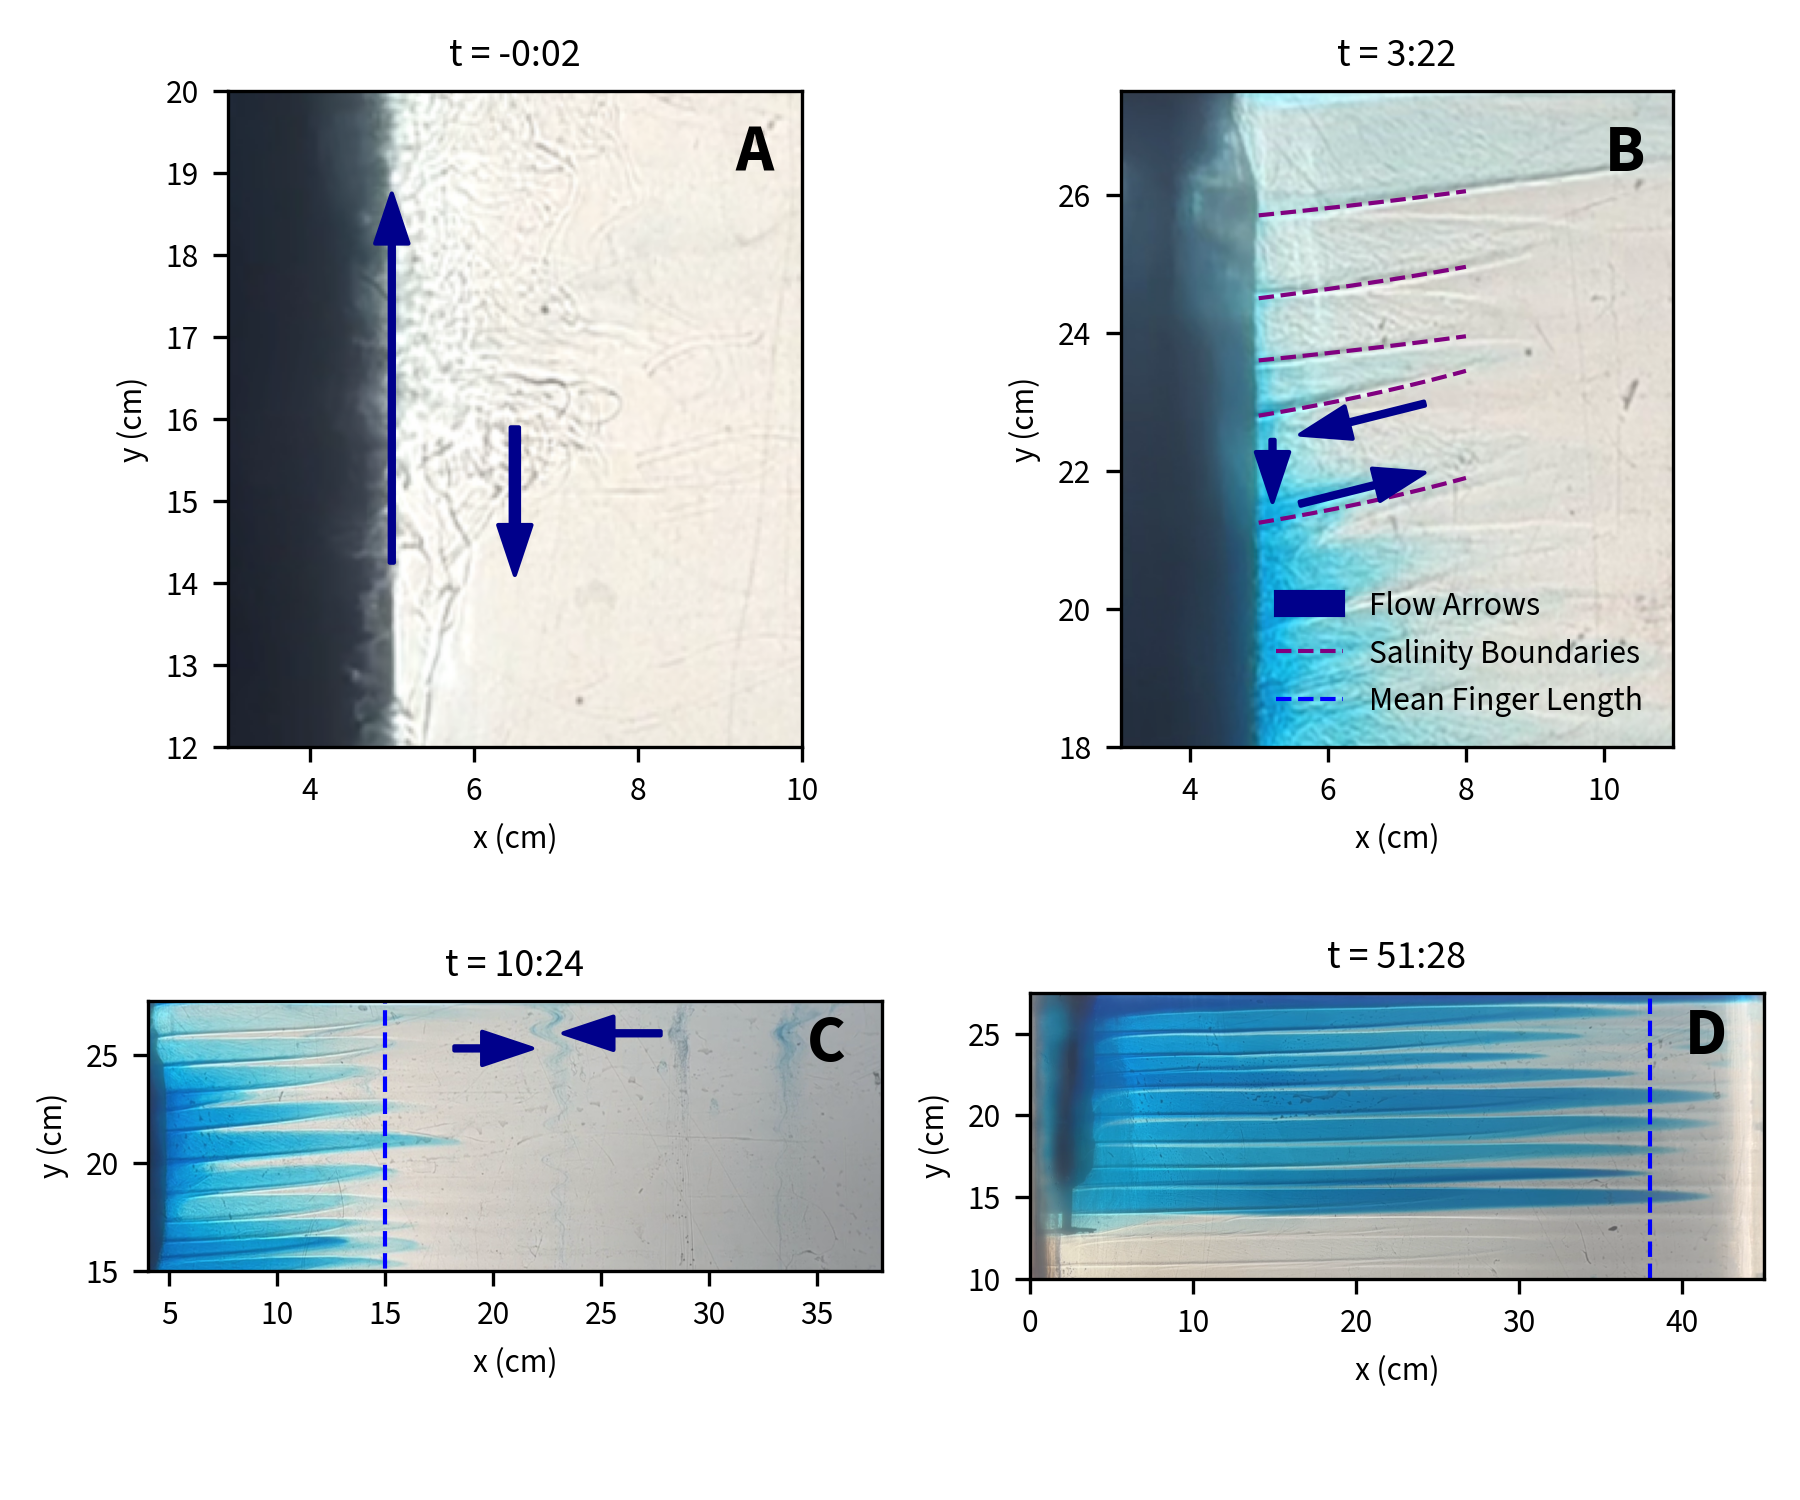
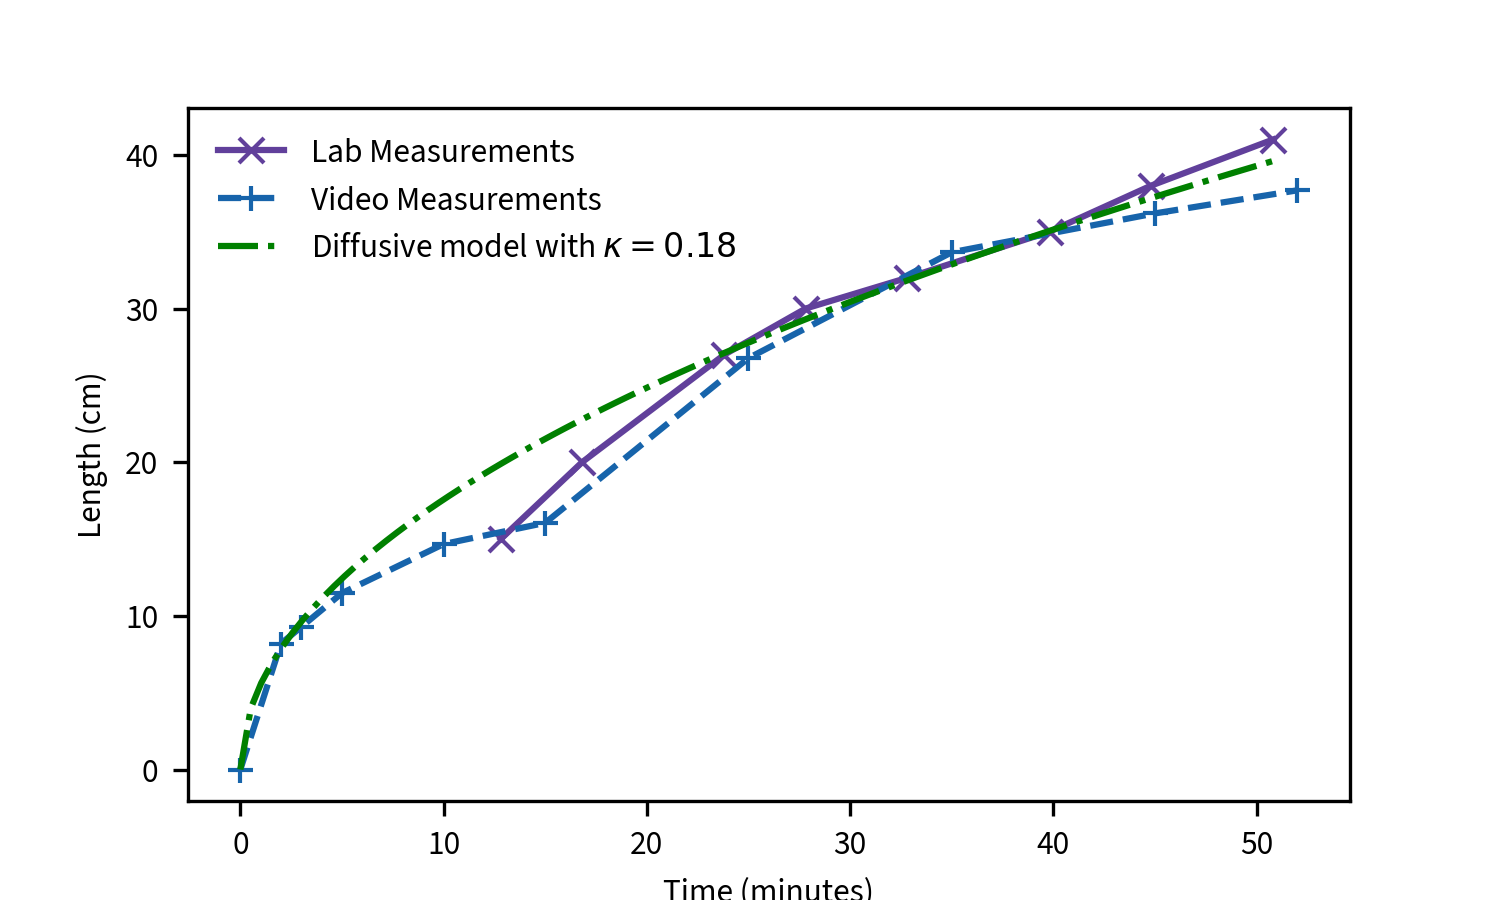
The overall motion of the fluid is dominated by two processes, a thin turbulent layer of upwelling meltwater, and the concentration of density boundaries by the balance of cooling and stratification into "finger" structures, which curve upwards due to temperature diffusion. These structures advect horizontally with an eddy diffusive timescale with 𝜅 = 0.18 m2 s−1. We measured their characteristic vertical length scale of ℎ = 1.20 cm ± 0.13, and calculated a constant for 10 of 𝑐 = 0.57 ± 0.06, and found reasonable agreement with previous work. (Huppert and Turner 1980; Kerr and McConnochie 2015; Yang et al. 2023).
Selected Figures